
Practice Management
The TWO Key Metrics that Affect a Well-Run Clinical Production Schedule

Dec
As the year draws to a close, many people are considering what changes they might do in the coming year to better their current situation and as an independent Optometrist one of your goals for the new year might be improving the performance of your practice. However, it is said, that you can’t improve what you can’t measure and trying to improve your practice can be a loaded goal, and one that can seem daunting to face if you don’t know where to start.
To evaluate the effectiveness and performance of a practice, there are two key metrics. The first is the number of thorough eye exams performed per hour, and the second is the revenue per exam. These two metrics stand out among the best indicators of a practice’s effectiveness and success. First, let’s divide into ‘complete eye exams per hour’ as this metric takes into account many variables, but it should be regularly monitored and reported each week for each OD employed by the practice.
To determine the complete exams per hour divide the number of eye exams performed during any time period by the total hours the OD works in the same time frame, including hours engaged in all activities.
Of course, it is important to note that there are factors that influence this key metric, like the efficiency of the exam process, effectiveness of appointment scheduling, the degree to which administrative and testing activities are delegated to staff, your patient recall effectiveness, and lastly but equally as important, your patient base size.
The median complete eye exams per OD hour for private practice ODs is 1.10 however, according to research by Jobson Medical Information, doctors say they only spend 15-20 minutes with patients during eye exams. Which means there is a huge opportunity to capitalize and see more patients per hour.
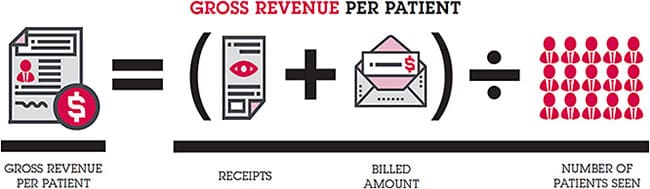
The other leading metric that reveals a practice’s productivity is RPE (Revenue Per Exam). In comparison to our previous key metric, tracking and increasing RPE can be more easily attained by first bench marking the RPE, then tracking the RPE and finally creating an action plan to improve the RPE.
The average RPE within the TSO Network is $389, if you don’t know your office’s RPE you should work with your Regional Manager to help you figure this key metric. Once you figured out this number, you can then work on increasing that number with a detailed plan in place.
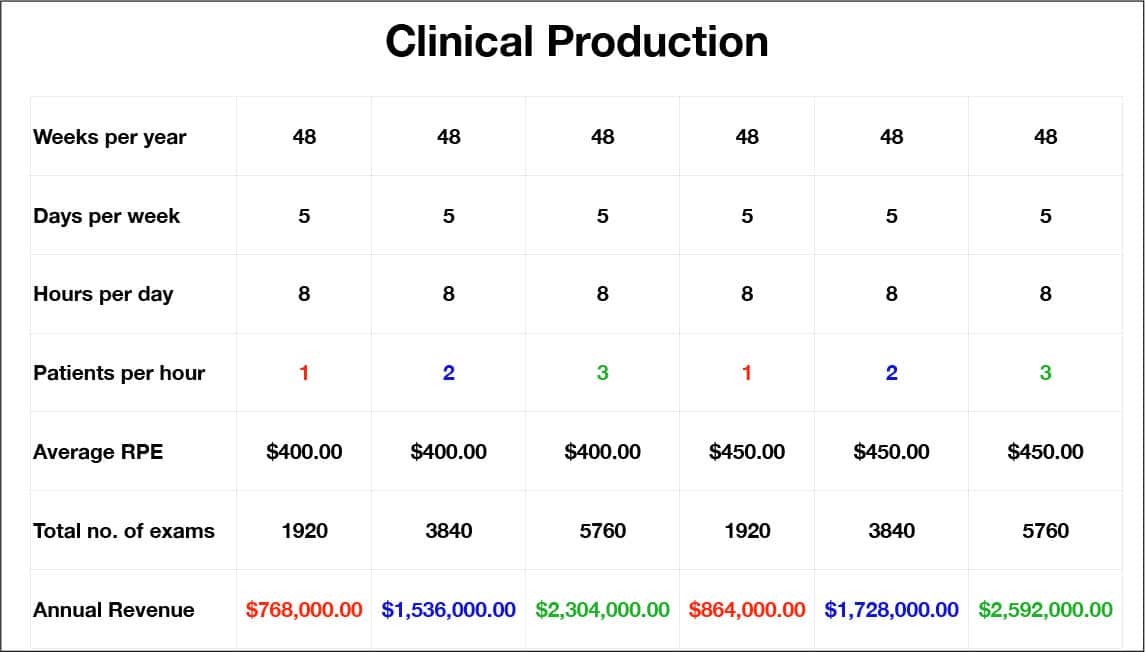
Above is a chart that was featured in the Management & Business Academy, sponsored by Essilor. It easily outlines how one practice can easily increase the number of patients seen, the revenue per exam and the overall productivity of a practice.
This ‘Clinical Production’ can be used as a guide to see the potential in each practice based on the weeks, days and hours worked per OD with an average RPE that ranges from $400-$450. It is important to note that this means that each OD in the practice can still have 4 weeks off per calendar year. This chart embodies the practicality of working smarter, not harder.
As you make your resolutions for the new year we encourage you to prioritize your office’s improvement plan and to carefully examine your ‘complete exams per hour’ and ‘RPE’ Improving these two metrics will not only have a notable influence on your annual revenue but it will also have a major impact on your staff and patients. If you adopt a similar clinical production like the one in the chart, you will go from helping hundreds of patients each year to helping thousands of patients each year and in the grand scheme of things we know that this is why we exist as an organization. We exist to serve, help and improve the lives of the patients in our communities.